

Το γεγονός ότι οι πλουτοπαραγωγικοί πόροι είναι οι σημαντικότεροι συντελεστές ισχύος στην διαδρομή των εθνών είναι κάτι πολύ γνωστό. Το ίδιο ισχύει πολύ περισσότερο για τους ενεργειακούς πλουτοπαραγωγικούς πόρους που αποτελούν την κινητήριο δύναμη της οικονομίας. Οι περισσότερες στρατηγικές των κρατών περιστρέφονται γύρω από το ενεργειακό ζήτημα. Οι στρατηγικές των μεγάλων δυνάμεων έχουν ως κύριο σκοπό την διασφάλιση των ενεργειακών πηγών (η στρατηγική της περιμέτρου της Ευρασίας των Ναυτικών δυνάμεων, πρώτα του ΗΒ και μετά τον ΗΠΑ είχαν ως κύριο στόχο την διασφάλιση του ελέγχου των ενεργειακών πόρων και την ασφαλή διακίνησή του προς τα κράτη τους). Από την άλλη πλευρά, όσα κράτη διαθέτουν ενεργειακούς πλουτοπαραγωγικούς πόρους αλλά είναι λιγότερο ισχυρά γίνονται στόχος.
Επειδή πολλά γράφονται για τους νέους πόρους και κυρίως το φυσικό αέριο παραθέτουμε την τελευταία έκθεση του Γραφείου Ενεργειακών Πληροφοριών των ΗΠΑ (ΕΙΑ), το οποίο, μιας και είναι δημόσια και εκτίθεται, λογικά αποτελεί μια έγκυρη πηγή πληροφοριών για τους ενεργειακούς πόρους.
Εδώ σημειώνουμε απλά ότι η Ελλάδα και η Κύπρος βρίσκονται σε μια περιφέρεια η οποία από άποψη ενέργειας θεωρείται κομβική. Οι στρατηγικές ανακατατάξεις είναι καθημερινές και ραγδαίες και οι αλλαγές φίλων και εχθρών αστάθμητες και απρόβλεπτες. Μόλις προχθές, για παράδειγμα, ανώτατος Ισραηλινός αξιωματούχος είπε ότι το επεισόδιο του Μαβί Μαρμαρά ξεπερνιέται και ότι οι σχέσεις του Ισραήλ με την Τουρκία αναμένεται να ομαλοποιηθούν πλήρως σύντομα. Γύρω από το κυπριακό, επίσης, για το οποίο έχουμε πολλές αναρτήσεις (χθες μόλις του κ. Δημήτρη Κωνσταντακόπουλου) σχετίζεται άμεσα με τους αγωγούς, στις συνεργασίες μεταξύ των περιφερειακών δυνάμεων και τις στρατηγικές των μεγάλων δυνάμεων. Η ενέργεια στην περιφέρειά μας, επιπλέον, αφορά το μέλλον των κούρδων και της ίδιας της Τουρκίας (βλ. τον χάρτη την ζώνη μεταξύ Συρίας και Τουρκίας όπου κατοικούν πολλοί κούρδοι). Από τα στοιχεία που παρατίθενται, επιπλέον, καλό είναι κανείς να προσέξει τους ενεργειακούς πλουτοπαραγωγικούς πόρους της Ρωσίας και των ΗΠΑ για να συνάγει λογικά συμπεράσματα, καθώς και τα αποθέματα σε περιοχές όπου τα τελευταία χρόνια και αυτή την στιγμή σοβούν κρίσεις.
Technically Recoverable Shale Oil and Shale Gas Resources: An Assessment of 137 Shale Formations in 41 Countries Outside the United States
Release date: June 10, 2013 Updated: June 13, 2013 Table 5 corrected
http://www.eia.gov/analysis/studies/worldshalegas/
Executive summary
This report provides an initial assessment of shale oil resources and updates a prior assessment of shale gas resources issued in April 2011. It assesses 137 shale formations in 41 countries outside the United States, expanding on the 69 shale formations within 32 countries considered in the prior report. The earlier assessment, also prepared by Advanced Resources International (ARI), was released as part of a U.S. Energy Information Administration (EIA) report titled World Shale Gas Resources: An Initial Assessment of 14 Regions Outside the United States.1
There were two reasons for pursuing an updated assessment of shale resources so soon after the prior report. First, geologic research and well drilling results not available for use in the 2011 report allow for a more informed evaluation of the shale formations covered in that report as well as other shale formations that it did not assess. Second, while the 2011 report focused exclusively on natural gas, recent developments in the United States highlight the role of shale formations and other tight plays as sources of crude oil, lease condensates, and a variety of liquids processed from wet natural gas.
As shown in Table 1, estimates in the updated report taken in conjunction with EIA’s own assessment of resources within the United States indicate technically recoverable resources of 345 billion barrels of world shale oil resources and 7,299 trillion cubic feet of world shale gas resources. The new global shale gas resource estimate is 10 percent higher than the estimate in the 2011 report.
| ARI report coverage | 2011 Report | 2013 Report |
| Number of countries | 32 | 41 |
| Number of basins | 48 | 95 |
| Number of formations | 69 | 137 |
| Technically recoverable resources, including U.S. | ||
| Shale gas (trillion cubic feet) | 6,622 | 7,299 |
| Shale / tight oil (billion barrels) | 32 | 345 |
| Note: The 2011 report did not include shale oil; however, the Annual Energy Outlook 2011 did (for only the U.S.) and is included here for completeness. | ||
| Table 1. Comparison of the 2011 and 2013 reports | ||
Although the shale resource estimates presented in this report will likely change over time as additional information becomes available, it is evident that shale resources that were until recently not included in technically recoverable resources constitute a substantial share of overall global technically recoverable oil and natural gas resources. The shale oil resources assessed in this report, combined with EIA’s prior estimate of U.S. tight oil resources that are predominantly in shales, add approximately 11 percent to the 3,012 billion barrels of proved and unproved technically recoverable nonshale oil resources identified in recent assessments. The shale gas resources assessed in this report, combined with EIA’s prior estimate of U.S. shale gas resources, add approximately 47 percent to the 15,583 trillion cubic feet of proved and unproven nonshale technically recoverable natural gas resources. Globally, 32 percent of the total estimated natural gas resources are in shale formations, while 10 percent of estimated oil resources are in shale or tight formations.
| Crude oil (billion barrels) | Wet natural gas (trillion cubic feet) | |
| Outside the United States | ||
| Shale oil and shale gas unproved resources | 287 | 6,634 |
| Other proved reserves 1 | 1,617 | 6,521 |
| Other unproved resources 2 | 1,230 | 7,296 |
| Total | 3,134 | 20,451 |
| Increase in total resources due to inclusion of shale oil and shale gas | 10% | 48% |
| Shale as a percent of total | 9% | 32% |
| United States | ||
| EIA shale / tight oil and shale gas proved reserves 3, 4 | n/a | 97 |
| EIA shale / tight oil and shale gas unproved resources5 | 58 | 567 |
| EIA other proved reserves6 | 25 | 220 |
| EIA other unproved resources5 | 139 | 1,546 |
| Total | 223 | 2,431 |
| Increase in total resources due to inclusion of shale oil and shale gas | 35% | 38% |
| Shale as a percent of total | 26% | 27% |
| Total World | ||
| Shale / tight oil and shale gas proved reserves | n/a | 97 |
| Shale / tight oil and shale gas unproved resources | 345 | 7,201 |
| Other proved reserves | 1,642 | 6,741 |
| Other unproved resources | 1,370 | 8,842 |
| Total | 3,357 | 22,882 |
| Increase in total resources due to inclusion of shale oil and shale gas | 11% | 47% |
| Shale as a percent of total | 10% | 32% |
| 1 Oil & Gas Journal, Worldwide Report, December 3, 2012. 2 Sources: U.S. Geological Survey, An Estimate of Undiscovered Conventional Oil and Gas Resources of the World, 2012, Fact Sheet 2012-3028, March 2012; U.S. Geological Survey, Assessment of Potential Additions to Conventional Oil and Gas Resources of the World (Outside the United States) from Reserve Growth, 2012, Fact Sheet 2012-3052, April 2012. 3 U.S. Energy Information Administration, U.S. Crude Oil, Natural Gas, and NG Liquids Proved Reserves With Data for 2010, Table 14. Shale natural gas proved reserves, reserves changes, and production, wet after lease separation, 2010; year-end reserves, August 1, 2012. 4 Proved tight oil reserves not broken out from total year end 2010 proved reserves; will be provided in future reporting of proved reserves. 5 Source: U.S. Energy Information Administration, Annual Energy Outlook 2013 Assumptions report, Tables 9.1 through 9.5.; wet natural gas volumes were determined by multiplying the AEO2013 dry unproved natural gas resource estimate by 1.045 so as to include NGPL. 6 Ibid. Table 5: Total natural gas proved reserves, reserves changes, and production, wet after lease separation, 2010; equals year-end figure minus the wet shale gas reserves reported for the year-end. | ||
| Table 2. Technically recoverable shale oil and shale gas unproved resources in the context of total world resources (assessment dates shown in footnotes) | ||
| BOX 1: TERMINOLOGY: SHALE OIL AND TIGHT OIL |
Although the terms shale oil.2 and tight oil are often used interchangeably in public discourse, shale formations are only a subset of all low permeability tight formations, which include sandstones and carbonates, as well as shales, as sources of tight oil production. Within the United States, the oil and natural gas industry typically refers to tight oil production rather than shale oil production, because it is a more encompassing and accurate term with respect to the geologic formations producing oil at any particular well. EIA has adopted this convention, and develops estimates of tight oil production and resources in the United States that include, but are not limited to, production from shale formations. The ARI assessment of shale formations presented in this report, however, looks exclusively at shale resources and does not consider other types of tight formations.
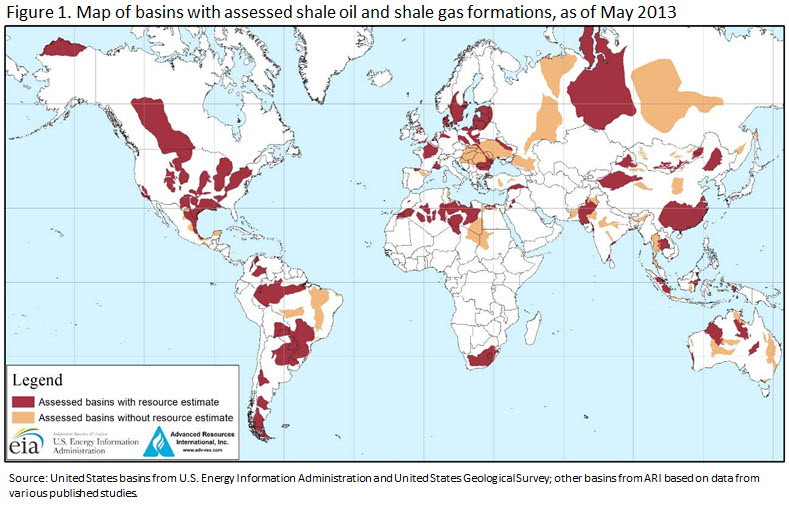
The report covers the most prospective shale formations in a group of 41 countries that demonstrate some level of relatively near-term promise and that have a sufficient amount of geologic data for a resource assessment. Figure 1 shows the location of these basins and the regions analyzed. The map legend indicates two different colors on the world map that correspond to the geographic scope of this assessment:
- Red colored areas represent the location of basins with shale formations for which estimates of the risked oil and natural gas in-place and technically recoverable resources were provided. Prospective shale formations rarely cover an entire basin.
- Tan colored areas represent the location of basins that were reviewed, but for which shale resource estimates were not provided, mainly due to the lack of data necessary to conduct the assessment.
- White colored areas were not assessed in this report.
 The estimates of technically recoverable shale oil and shale gas resources summarized in Tables 1 and 2 and presented in country-level detail in Table 3 andTable 4 represent risked resources for the formations reviewed. These estimates are uncertain given the relatively sparse data that currently exist. The methodology is outlined below and described in more detail in the accompanying contractor report. At the current time, there are efforts underway to develop more detailed country-specific shale gas resource assessments. A number of U.S. federal agencies are providing assistance to other countries under the auspices of the Unconventional Gas Technical Engagement Program (UGTEP) formerly known as Global Shale Gas Initiative (GSGI), which the U.S. Department of State launched in April 2010.3
Tables 5 and 6 provide a listing of the 10 countries holding the largest resources of shale oil and shale gas based on this assessment of shale resources in 41 countries and prior work by EIA and USGS for the United States.
| Rank | Country | Shale oil (billion barrels) | |
| 1 | Russia | 75 | |
| 2 | U.S. 1 | 58 | (48) |
| 3 | China | 32 | |
| 4 | Argentina | 27 | |
| 5 | Libya | 26 | |
| 6 | Australia | 18 | |
| 7 | Venezuela | 13 | |
| 8 | Mexico | 13 | |
| 9 | Pakistan | 9 | |
| 10 | Canada | 9 | |
| World Total | 345 | (335) | |
| 1 EIA estimates used for ranking order. ARI estimates in parentheses. | |||
| Table 5. Top 10 countries with technically recoverable shale oil resources | |||
| Rank | Country | Shale gas (trillion cubic feet) | |
| 1 | China | 1,115 | |
| 2 | Argentina | 802 | |
| 3 | Algeria | 707 | |
| 4 | U.S.1 | 665 | (1,161) |
| 5 | Canada | 573 | |
| 6 | Mexico | 545 | |
| 7 | Australia | 437 | |
| 8 | South Africa | 390 | |
| 9 | Russia | 285 | |
| 10 | Brazil | 245 | |
| World Total | 7,299 | (7,795) | |
| 1 EIA estimates used for ranking order. ARI estimates in parentheses. | |||
| Table 6. Top 10 countries with technically recoverable shale gas resources | |||
When considering the market implications of abundant shale resources, it is important to distinguish between a technically recoverable resource, which is the focus of this report, and an economically recoverable resource. Technically recoverable resources represent the volumes of oil and natural gas that could be produced with current technology, regardless of oil and natural gas prices and production costs. Economically recoverable resources are resources that can be profitably produced under current market conditions. The economic recoverability of oil and gas resources depends on three factors: the costs of drilling and completing wells, the amount of oil or natural gas produced from an average well over its lifetime, and the prices received for oil and gas production. Recent experience with shale gas in the United States and other countries suggests that economic recoverability can be significantly influenced by above-the-ground factors as well as by geology. Key positive above-the-ground advantages in the United States and Canada that may not apply in other locations include private ownership of subsurface rights that provide a strong incentive for development; availability of many independent operators and supporting contractors with critical expertise and suitable drilling rigs and, preexisting gathering and pipeline infrastructure; and the availability of water resources for use in hydraulic fracturing.
Because they have proven to be quickly producible in large volumes at a relatively low cost, tight oil and shale gas resources have revolutionized U.S. oil and natural gas production, providing 29 percent of total U.S. crude oil production and 40 percent of total U.S. natural gas production in 2012. However, given the variation across the world’s shale formations in both geology and above-the-ground conditions, the extent to which global technically recoverable shale resources will prove to be economically recoverable is not yet clear. The market effect of shale resources outside the United States will depend on their own production costs, volumes, and wellhead prices. For example, a potential shale well that costs twice as much and produces half the output of a typical U.S. well would be unlikely to back out current supply sources of oil or natural gas. In many cases, even significantly smaller differences in costs, well productivity, or both can make the difference between a resource that is a market game changer and one that is economically irrelevant at current market prices.
EIA is often asked about the implications of abundant shale resources for natural gas and oil prices. Because markets for natural gas are much less globally integrated than world oil markets, the rapid growth in shale gas production since 2006 has significantly lowered natural gas prices in the United States and Canada compared to prices elsewhere and to prices that would likely have prevailed absent the shale boom.
Turning to oil prices, it is important to distinguish between short-term and long-term effects. The increase in U.S. crude oil production in 2012 of 847,000 barrels per day over 2011 was largely attributable to increased production from shales and other tight resources. That increase is likely to have had an effect on prices in 2012. Even with that increase, global spare production capacity was low in 2012 relative to recent historical standards – without it, global spare capacity would have been considerably lower, raising the specter of significantly higher oil prices.
However, the situation is somewhat different in a longer-run setting, in which both global supply and demand forces are likely to substantially reduce the sensitivity of world oil market prices to a rise in production from any particular country or resource outside of the Organization of the Petroleum Exporting Countries (OPEC). Undoubtedly, significant volumes of oil production from shale resources that are economically recoverable at prices below those desired by OPEC decision-makers would add to the challenge facing OPEC as it seeks to manage oil prices. However, the magnitude of this challenge is probably smaller than the challenges associated with the possible success of some of its own member countries in overcoming barriers stemming from internal discord or external constraints that have kept their recent production well below levels that would be preferred by national governments and would be readily supported by their ample resources. Ultimately, the possibility of significant price impacts in response to either of these potential challenges will depend on the ability and willingness of other OPEC member countries to offset the impact of higher production on prices by reducing their output or their investment in additional production capacity. Efforts to limit the price effect of higher production could also be supported by the demand side of the market over the long term since any persistent period of lower prices would encourage a demand response that would tend to soften any long-term price-lowering effects of increased production.
The methods used for estimating shale resources in the current report are similar to those used previously. Because this report estimates shale oil resources for the first time, it distinguishes between the oil and natural gas portions of a shale formation, which has resulted in a portion of some of the area that was previously mapped as natural gas to now be designated as oil; consequently reducing the natural gas resource estimate and replacing it with an oil resource estimate. Also, the current report more rigorously applies the assessment methodology, such as the 2 percent minimum total organic content (TOC) requirement, which in this instance reduces the prospective area and resource estimates for some shales.
Future efforts
While the current report considers more shale formations than were assessed in the previous version, it still does not assess many prospective shale formations, such as those underlying the large oil fields located in the Middle East and the Caspian region. Further improvement in both the quality of the assessments and an increase the number of formations assessed should be possible over time.
The priority of such work compared to other possible projects, including efforts to determine the likely costs of production of oil and natural gas from shale resources around the world, will need to be determined in the light of available budgets.
Additional Context
Development of shale resources to date
Since the release of EIA’s 2011 assessment of technically recoverable natural gas resources from selected shale formations in 32 countries, the blossoming of interest in shale resources outside the United States has resulted in the publication of more and better information on the geology of many shale formations. Wells drilled in shale formations in countries such as Argentina, China, Mexico, and Poland have also helped to clarify their geologic properties and productive potential. Therefore, the current report incorporates more complete and better quality geologic data on many of the shale formations examined in the first report, including areal extent, thickness, porosity, pressure, natural faulting, and carbon content. Based on updated geologic information, a few shale formations that were assessed in the previous report have been dropped.
It has become clear from recent developments in the United States that shale formations and other tight plays can also produce crude oil, lease condensates, and a variety of liquids processed from wet natural gas. For example, U.S. crude oil production rose by 847,000 barrels per day in 2012, compared with 2011, by far the largest growth in crude oil production in any country. Production from shales and other tight plays accounted for nearly all of this increase, reflecting both the availability of recoverable resources and favorable above-the-ground conditions for production. (For a further discussion of U.S. shale gas and tight oil production, see “Production from Shale Resources In The United States“.)
The successful investment of capital and diffusion of shale oil and shale gas technologies has continued into Canadian shales. Canada’s tight oil production averaged 291,498 barrels per day in 20124 and its shale gas production was 0.7 trillion cubic feet in 2012.5 There has been interest expressed or exploration activities begun in shale formations in a number of other countries, including Algeria, Argentina, Australia, China, India, Mexico, Poland, Romania, Russia, Saudi Arabia, Turkey, Ukraine, and the United Kingdom.
It is clearly important for those interested in the evolution of global markets for liquid fuels to assess the magnitude and extent of recoverable resources from shale formations.
BOX 2: PRODUCTION FROM SHALE RESOURCES IN THE UNITED STATES The use of horizontal drilling in conjunction with hydraulic fracturing has greatly expanded the ability of producers to profitably produce oil and natural gas from low permeability geologic formations, particularly shale formations. Application of fracturing techniques to stimulate oil and natural gas production began to grow in the 1950s, although experimentation dates back to the 19th century. The application of horizontal drilling to oil production began in the early 1980s, by which time the advent of improved downhole drilling motors and the invention of other necessary supporting equipment, materials, and technologies, particularly downhole telemetry equipment (i.e., measurement-while-drilling) brought some applications within the realm of commercial viability. The advent of large-scale shale gas production did not occur until around 2000 when shale gas production became a commercial reality in the Barnett Shale located in north-central Texas. As commercial success of the Barnett Shale became apparent, other companies started drilling wells in this formation so that by 2005, the Barnett Shale alone was producing almost half a trillion cubic feet per year of natural gas. As natural gas producers gained confidence in their ability to profitably produce natural gas in the Barnett Shale and confirmation of this ability was provided by the results in the Fayetteville Shale in northern Arkansas, they began pursuing the development of other shale formations, including the Haynesville, Marcellus, Woodford, and Eagle Ford shales. The proliferation of drilling activity in the Lower 48 shale formations has increased dry shale gas production in the United States from 0.3 trillion cubic feet in 2000 to 9.6 trillion cubic feet in 2012, or to 40 percent of U.S. dry natural gas production. Dry shale gas reserves increased to 94.4 trillion cubic feet by year-end 2010, when they equaled 31 percent of total natural gas reserves.6 EIA’s current estimate of technically recoverable dry shale gas resources is 637 trillion cubic feet, including proved reserves of 94 trillion cubic feet.7 Given a total estimated U.S. dry natural gas resource of 2,335 trillion cubic feet, shale gas resources constitute 27 percent of the domestic natural gas resource represented in the AEO2013 projections and 36 percent of Lower 48 onshore resources. The growth in tight oil production shows how important shale oil production has become in the United States. U.S. tight oil production increased from an average 0.2 million barrels per day in 2000 to an average of 1.9 million barrels per day in 2012 for 10 select formations.8 The growth in tight oil production has been so rapid that U.S. tight oil production was estimated to have reached 2.2 million barrels per day in December 2012. Although EIA has not published tight oil proved reserves, EIA’s current estimate of unproved U.S. tight oil resources is 58 billion barrels.9 |
Notable changes in shale gas estimates from the 2011 report
Shale gas resource estimates for some formations were revised lower in the current report, including those for Norway’s Alum Shale, Poland’s Lubin Basin, Mexico’s Eagle Ford Shale in the Burgos Basin, South Africa’s Karoo Basin, and China’s Qiongzhusi Shale in the Sichuan Basin and the Lower Cambrian shales in the Tarim Basin. As discussed below, these adjustments, based on new information in some cases, reflect a reduced estimate of total hydrocarbon resources, while in others they reflect a reclassification of resources previously identified as natural gas to the category of crude oil or condensates. This discussion is not meant to be exhaustive but rather illustrative of why some of the shale resource estimates were reduced.
Norway’s shale gas assessment dropped from 83 trillion cubic feet in 2011 to zero in the current report because of the disappointing results obtained from three Alum Shale wells drilled by Shell Oil Company in 2011. The Shell wells were drilled in the less geologically complex portion of the Alum Shale that exists in Sweden, which significantly reduced the prospects for successful shale wells in the more geologically complex portion of the Alum Shale that exists in Norway.
Poland’s Lubin Basin shale gas resource estimate was reduced from 44 trillion cubic feet in the 2011 report to 9 trillion cubic feet in this report. The resource reduction was due to the more rigorous application of the requirement that a shale formation have at least a 2 percent minimum total organic content (TOC). The more rigorous application of the TOC minimum requirement, along with better control on structural complexity, reduced the prospective area from 11,660 square miles to 2,390 square miles. For Poland as a whole, the shale gas resource estimate was reduced from 187 trillion cubic feet in the 2011 report to 148 trillion cubic feet in this report.
In Mexico, the Eagle Ford Shale gas resource estimate in Burgos Basin was reduced from 454 trillion cubic feet in the 2011 report to 343 trillion cubic feet in this report. Based on better geologic data regarding the areal extent of the formation, the prospective shale area was reduced from 18,100 square miles in the 2011 report to 17,300 square miles. A portion of the 17,300 square miles is prospective for oil, which reduced the area prospective for natural gas. Cumulatively, these changes resulted in a lower shale gas resource estimate for the Burgos Basin’s Eagle Ford formation, while adding oil resources.
In South Africa, the prospective area for the three shale formations in the Karoo Basin was reduced by 15 percent from 70,800 square miles to 60,180 square miles. This reduction in the prospective area was largely responsible for the lower South African shale gas resource estimate shown in this report. The Whitehill Shale’s recovery rate and resource estimate were also reduced because of the geologic complexity caused by igneous intrusions into that formation. For South Africa as a whole, the shale gas resource estimate was reduced from 485 trillion cubic feet in the 2011 report to 390 trillion cubic feet in this report.
In China, better information regarding the total organic content and geologic complexity resulted in a reduction of the shale gas resource in the Qiongzhusi formation in the Sichuan Basin and Lower Cambrian shales in the Tarim Basin. The Qiongzhusi Shale gas resource estimate was reduced from 349 trillion cubic feet in the 2011 report to 125 trillion cubic feet in this report. The lower estimate resulted from the prospective area being reduced from 56,875 square miles to 6,500 square miles. Similarly, the prospective area of the Lower Cambrian shales was reduced from 53,560 square miles in 2011 to 6,520 square miles in the current report, resulting in a reduction in the shale gas estimate from 359 trillion cubic feet in 2011 to 44 trillion cubic feet now. For China as a whole, the shale gas resource estimate was reduced from 1,275 trillion cubic feet in the 2011 report to 1,115 trillion cubic feet in this report.
Methodology
The shale formations assessed in this report were selected for a combination of factors that included the availability of data, country-level natural gas import dependence, observed large shale formations, and observations of activities by companies and governments directed at shale resource development. Shale formations were excluded from the analysis if one of the following conditions is true: (1) the geophysical characteristics of the shale formation are unknown; (2) the average total carbon content is less than 2 percent; (3) the vertical depth is less than 1,000 meters (3,300 feet) or greater than 5,000 meters (16,500 feet), or (4) relatively large undeveloped oil or natural gas resources.
The consultant relied on publicly available data from technical literature and studies on each of the selected international shale gas formations to first provide an estimate of the “risked oil and natural gas in-place,” and then to estimate the unproved technically recoverable oil and natural gas resource for that shale formation. This methodology is intended to make the best use of sometimes scant data in order to perform initial assessments of this type.
The risked oil and natural gas in-place estimates are derived by first estimating the volume of in-place resources for a prospective formation within a basin, and then factoring in the formation’s success factor and recovery factor. The success factor represents the probability that a portion of the formation is expected to have attractive oil and natural gas flow rates. The recovery factor takes into consideration the capability of current technology to produce oil and natural gas from formations with similar geophysical characteristics. Foreign shale oil recovery rates are developed by matching a shale formation’s geophysical characteristics to U.S. shale oil analogs. The resulting estimate is referred to as both the risked oil and natural gas in-place and the technically recoverable resource. The specific tasks carried out to implement the assessment include:
- Conduct a preliminary review of the basin and select the shale formations to be assessed.
- Determine the areal extent of the shale formations within the basin and estimate its overall thickness, in addition to other parameters.
- Determine the prospective area deemed likely to be suitable for development based on depth, rock quality, and application of expert judgment.
- Estimate the natural gas in-place as a combination of free gas10 and adsorbed gas11 that is contained within the prospective area. Estimate the oil in-place based on pore space oil volumes.
- Establish and apply a composite success factor made up of two parts. The first part is a formation success probability factor that takes into account the results from current shale oil and shale gas activity as an indicator of how much is known or unknown about the shale formation. The second part is a prospective area success factor that takes into account a set of factors (e.g., geologic complexity and lack of access) that could limit portions of the prospective area from development.
- For shale oil, identify those U.S. shales that best match the geophysical characteristics of the foreign shale oil formation to estimate the oil in-place recovery factor.12 For shale gas, determine the recovery factor based on geologic complexity, pore size, formation pressure, and clay content, the latter of which determines a formation’s ability to be hydraulically fractured. The gas phase of each formation includes dry natural gas, associated natural gas, or wet natural gas. Therefore, estimates of shale gas resources in this report implicitly include the light wet hydrocarbons that are typically coproduced with natural gas.
- Technically recoverable resources13 represent the volumes of oil and natural gas that could be produced with current technology, regardless of oil and natural gas prices and production costs. Technically recoverable resources are determined by multiplying the risked in-place oil or natural gas by a recovery factor.
Based on U.S. shale production experience, the recovery factors used in this report for shale gas generally ranged from 20 percent to 30 percent, with values as low as 15 percent and as high as 35 percent being applied in exceptional cases. Because of oil’s viscosity and capillary forces, oil does not flow through rock fractures as easily as natural gas. Consequently, the recovery factors for shale oil are typically lower than they are for shale gas, ranging from 3 percent to 7 percent of the oil in-place with exceptional cases being as high as 10 percent or as low as 1 percent. The consultant selected the recovery factor based on U.S. shale production recovery rates, given a range of factors including mineralogy, geologic complexity, and a number of other factors that affect the response of the geologic formation to the application of best practice shale gas recovery technology. Because most shale oil and shale gas wells are only a few years old, there is still considerable uncertainty as to the expected life of U.S. shale wells and their ultimate recovery. The recovery rates used in this analysis are based on an extrapolation of shale well production over 30 years. Because a shale’s geophysical characteristics vary significantly throughout the formation and analog matching is never exact, a shale formation’s resource potential cannot be fully determined until extensive well production tests are conducted across the formation.
Key exclusions
In addition to the key distinction between technically recoverable resources and economically recoverable resources that has been already discussed at some length, there are a number of additional factors outside of the scope of this report that must be considered in using its findings as a basis for projections of future production. In addition, several other exclusions were made for this report to simplify how the assessments were made and to keep the work to a level consistent with the available funding.
Some of the key exclusions for this report include:
- Tight oil produced from low permeability sandstone and carbonate formations that can often be found adjacent to shale oil formations. Assessing those formations was beyond the scope of this report.
- Coalbed methane and tight natural gas and other natural gas resources that may exist within these countries were also excluded from the assessment.
- Assessed formations without a resource estimate, which resulted when data were judged to be inadequate to provide a useful estimate. Including additional shale formations would likely increase the estimated resource.
- Countries outside the scope of the report, the inclusion of which would likely add to estimated resources in shale formations. It is acknowledged that potentially productive shales exist in most of the countries in the Middle East and the Caspian region, including those holding substantial nonshale oil and natural gas resources.
- Offshore portions of assessed shale oil and shale gas formations were excluded, as were shale oil and shale gas formations situated entirely offshore.
The U.S. shale experience and international shale development
This report treats non-U.S. shales as if they were homogeneous across the formation. If the U.S. experience in shale well productivity is replicated elsewhere in the world, then it would be expected that shale formations in other countries will demonstrate a great deal of heterogeneity, in which the geophysical characteristics vary greatly over short distances of a 1,000 feet or less. Shale heterogeneity over short distances is demonstrated in a recent article that shows that oil and natural gas production performance varies considerably across the fractured stages of a horizontal lateral and that a significant number of fractured stages do not produce either oil or natural gas; in some cases, up to 50 percent of the fractured stages are not productive.14 The authors of that article noted that:
“…a study including the production logs from 100 horizontal wells showed an enormous discrepancy in production between perforation clusters that is likely due to rock heterogeneity.”
One reason why 3,000-to-5,000-foot horizontal laterals are employed in the United States is to increase the likelihood that a portion of the horizontal lateral will be sufficiently productive to make the well profitable.
Because of shale rock heterogeneity over short distances, neighboring well productivity varies significantly, and well productivity across the formation varies even more. Shale formation productivity also varies by depth. For example, Upper Bakken Member shale wells are less productive than Lower Bakken Member shale wells.
Shale heterogeneity also means that some areas across the shale formation can have relatively high productivity wells (also known as sweet spots), while wells in other regions have commensurately lower productivities. However, because productivity also varies significantly for wells located in the same neighborhood, a single well test cannot establish a formation’s productivity or even the productivity within its immediate neighborhood. This complicates the exploration phase of a shale’s development because a company has to weigh the cost of drilling a sufficient number of wells to determine the local variation in well productivity against the risk that after drilling enough wells, the formation under the company’s lease still proves to be unprofitable.15
For those foreign shales that are expected to have both natural gas-prone and oil-prone portions, formation heterogeneity means that there could be an extended transition zone across a shale formation from being all or mostly natural gas to being mostly oil. The best example of this gradual and extended transition from natural gas to oil is found in the Eagle Ford Shale in Texas, where the distance between the natural gas-only and mostly-oil portions of the formation are separated by 20 to 30 miles, depending on the location. This transition zone is important for two reasons.
First, a well’s production mix of oil, natural gas, and natural gas liquids can have a substantial impact on that well’s profitability both because of the different prices associated with each component and because liquids have multiple transportation options (truck, rail, barge, pipeline), whereas large volumes of natural gas are only economic to transport by pipeline. Because many countries have large natural gas deposits that well exceed the indigenous market’s ability to consume that natural gas (e.g., Qatar), the shale gas is of no value to the producer and is effectively stranded until a lengthy pipeline or LNG export terminal has been built to transport the natural gas to a country with a larger established consumption market.
Second, the production of shale oil requires that at least 15 percent to 25 percent of the pore fluids be in the form of natural gas so that there is sufficient gas-expansion to drive the oil to the well-bore. In the absence of natural gas to provide reservoir drive, shale oil production is problematic and potentially uneconomic at a low production rate. Consequently, producer drilling activity that currently targets oil production in the Eagle Ford shale is primarily focused on the condensate-rich portion of the formation rather than those portions that have a much greater proportion of oil and commensurately less natural gas.
Shale formation heterogeneity also somewhat confounds the process of testing alternative well completion approaches to determine which approach maximizes profits. Because of the potential variation in neighboring well productivity, it is not always clear whether a change in the completion design is responsible for the change in well productivity. Even a large well sample size might not resolve the issue conclusively as drilling activity moves through inherently higher and lower productivity areas.
Shale formation heterogeneity also bears on the issue of determining a formation’s ultimate resource potential. Because companies attempt to identify and produce from the high productivity areas first, the tendency is for producers to concentrate their efforts in those portions of the formation that appear to be highly productive, to the exclusion of much of the rest of the formation. For example, only about 1 percent of the Marcellus Shale has been production tested. Therefore, large portions of a shale formation could remain untested for several decades or more, over which time the formation’s resource potential could remain uncertain.
Footnotes
1 U.S. Energy Information Administration, World Shale Gas Resources: An Initial Assessment of 14 Regions Outside the United States, April 2011, Washington, DC
2 This is not to be confused with oil shale, which is a sedimentary rock with solid organic content (kerogen) but no resident oil and natural gas fluids.
3 Other U.S. government agencies that participate in the UGTEP include: the U.S. Department of Energy’s Office of Fossil Energy (DOE/FE); the U.S. Agency for International Development (USAID); the U.S. Department of Interior’s U.S. Geological Survey (USGS); U.S. Department of Interior’s Bureau of Ocean Energy Management (BOEM); the U.S. Department of Commerce’s Commercial Law Development Program (CLDP); and the U.S. Environmental Protection Agency (EPA).
4 National Energy Board, Michael Johnson, personal correspondence on May 10, 2013.
5 National Energy Board, Short-term Canadian Natural Gas Deliverability 2013-2015 – Energy Market Assessment, May 2013, Appendix C, Table C.1, pages 69-70; figure includes the Montney formation production.
6 Reserves refer to deposits of oil, natural gas, and natural gas liquids that are proven and readily producible. Reserves are a subset of the technically recoverable resource estimate for a source of supply. Technically recoverable resource estimates encompass oil and gas reserves, the producible oil and natural gas that are inferred to exist in current oil and gas fields, as well as undiscovered, unproved oil and natural gas that can be produced using current technology. For example, EIA’s estimate of all forms of technically recoverable natural gas resources in the United States for the Annual Energy Outlook 2013 early release is 2,326.7 trillion cubic feet, of which 542.8 trillion cubic feet consists of unproved shale gas resources. Also included in the resource total are 304.6 trillion cubic feet of proved reserves that consist of all forms of readily producible natural gas, including 94.4 trillion cubic feet of shale gas.
7 Source: AEO2013 Assumptions report, Tables 9.1 through 9.5.
8 The 10 select formations are the Austin Chalk, Bakken, Bone Springs, Eagle Ford, Granite Wash, Monterey, Niobrara/Codell, Spraberry, Wolfcamp, and Woodford. Some of these formations have produced oil for many decades in the higher permeability portions of the formations.
9 Op. Cit. AEO2013.
10 Free gas is natural gas that is trapped in the pore spaces of the shale. Free gas can be the dominant source of natural gas for the deeper shales.
11 Adsorbed gas is natural gas that adheres to the surface of the shale, primarily the organic matter of the shale, due to the forces of the chemical bonds in both the substrate and the natural gas that cause them to attract. Adsorbed gas can be the dominant source of natural gas for the shallower and higher organically rich shales.
12 The recovery factor pertains to percent of the original oil or natural gas in-place that is produced over the life of a production well.
13 Referred to as risked recoverable resources in the consultant report.
14 Society of Petroleum Engineers, Journal of Petroleum Technology, Utpal Ganguly and Craig Cipolla (Schlumberger), “Multidomain Data and Modeling Unlock Unconventional Reservoir Challenges,” August 2012, pages 32-37; see Figure 2 for the variation in productivity along the fractured stages of four wells.
15 Of course, there will be instances where the geophysical properties of a single well rock sample are so poor (e.g. high clay content, low porosity, low carbon content) or a well production test is so discouraging that the company abandons any further attempts in that portion of the formation.